
Stockaivisor: Generative AI-powered Financial and Return Analysis
Given the nature and complexity of today's financial markets, investors need tools that help them to figure out the intricacy of markets. Stockaivisor is an attempt to tackle this issue introducing cutting edge generative AI tools. Stockaivisor offers a wide range of tools to facilitate the decision making process of the investors in a sound and reliable way.
Stockavisor covers all aspects of financial analysis , enabling users to make informed decisions using comprehensive tools rather than relying on limited knowledge. With that being said, it is worth mentioning what types of analyzes Stockavisor has:
Classical Financial Analyses
- Return Analysis
- Financial Statement Analysis
- Volatility Analysis
- Risk Analysis
- Factor Analysis
- Correlation
- Technical Indicators
Predictive Analysis
Financial Statement Analysis:
- Sentiment Analysis
- Topic Detection
- Summarization
- News Sentiment Analysis
- Daily AI Reporting
- Robodyadvisor
- StockAid Academy
Sounds exciting, doesn't it? Let me briefly talk about these tools, but do not worry; we will dive deep into these tools in other parts of this blog series. Stockavisor offers all types of classical analyses, including return, factor, financial statement, risk, correlation, and technical analysis. In this blog, I will talk about return analysis, and you will find out how you can benefit from Stockavisor in this sense.
Return Analysis
In return analysis, you can see how returns of the asset behave over the last ten years using different window lengths and benchmarks. To keep it simple, for instance, say you picked Apple ( AAPL ) stock with a window length of 1 month. This means that Apple stock returns is computed for each business day on a monthly rolling base. Here is what it looks like:
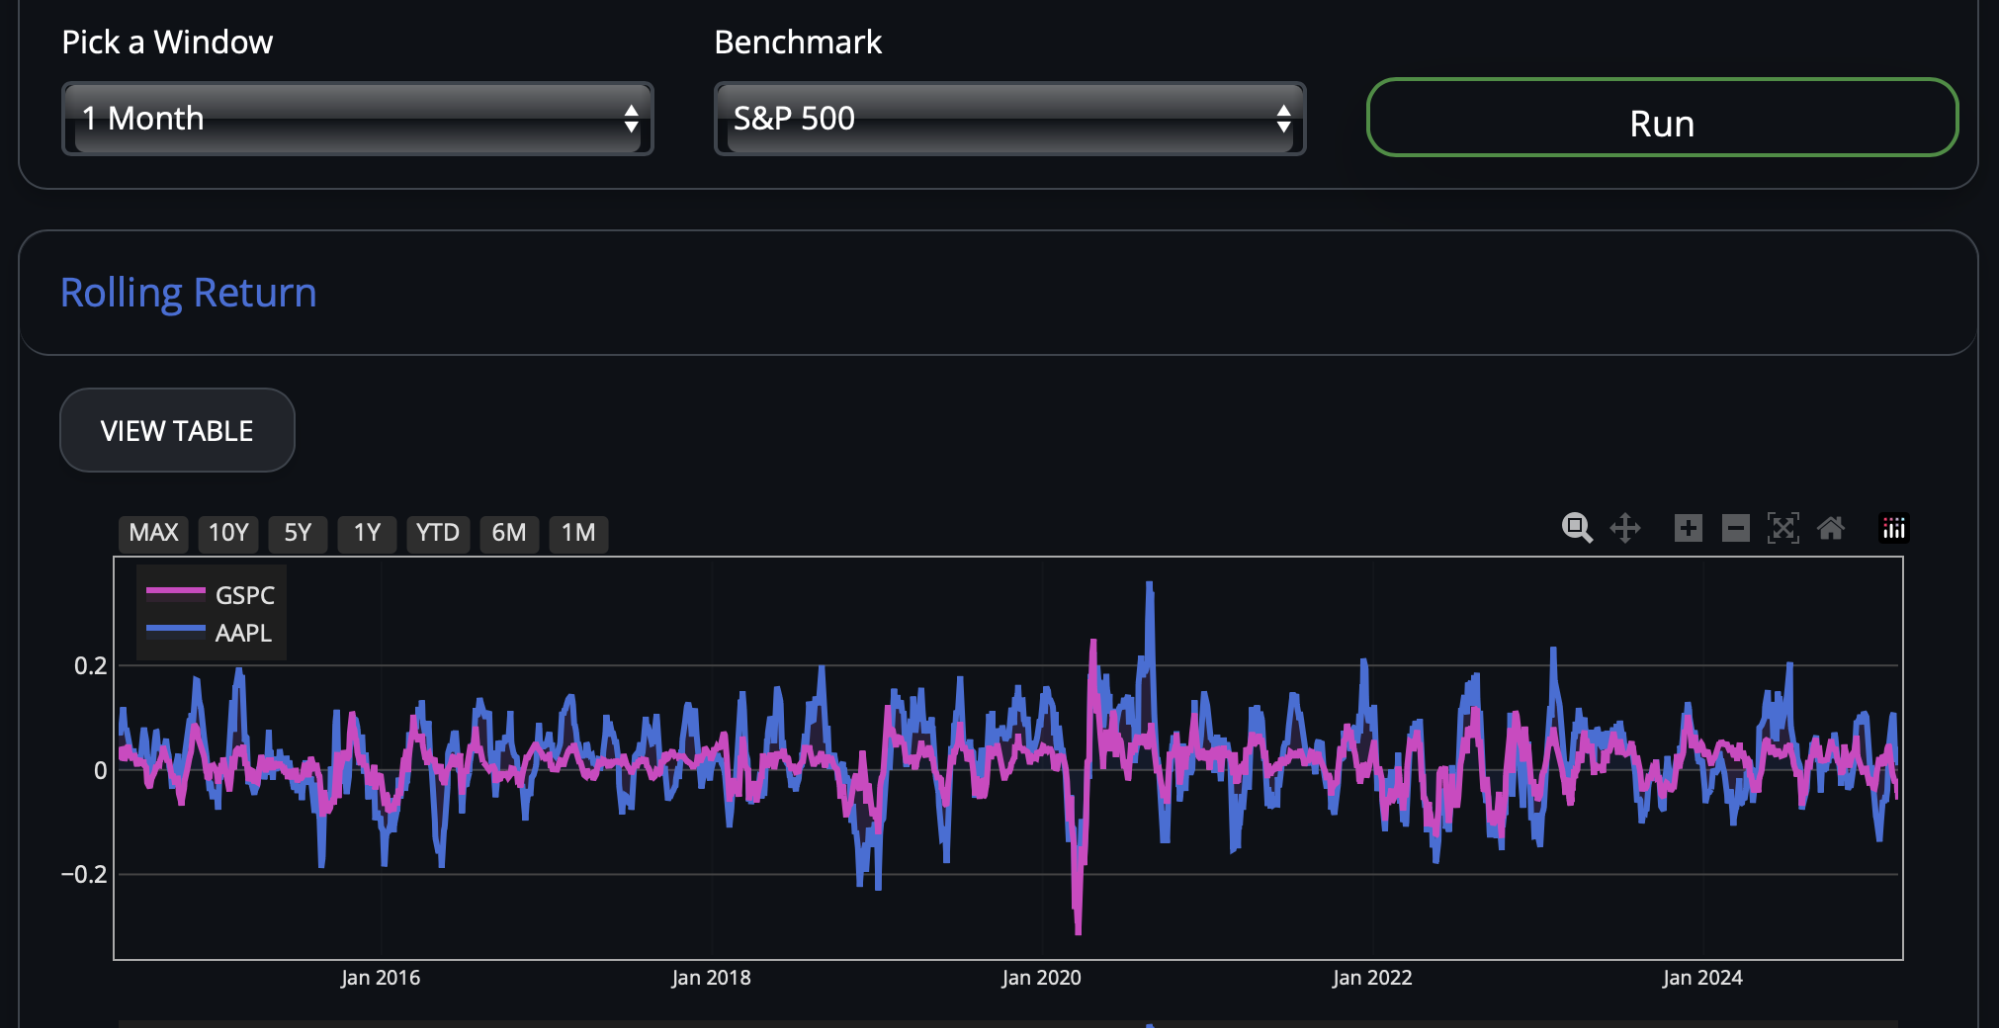
As a benchmark, you have many alternatives depending on which stock you choose. In the above graph, the S&P-500 is the benchmark market.
The return analysis part does not only include the returns' calculation, additionally, it includes drawdown analysis and risk-adjusted ratios. Drawdown analysis indicates the decline from a peak to a trough in the value of an asset.
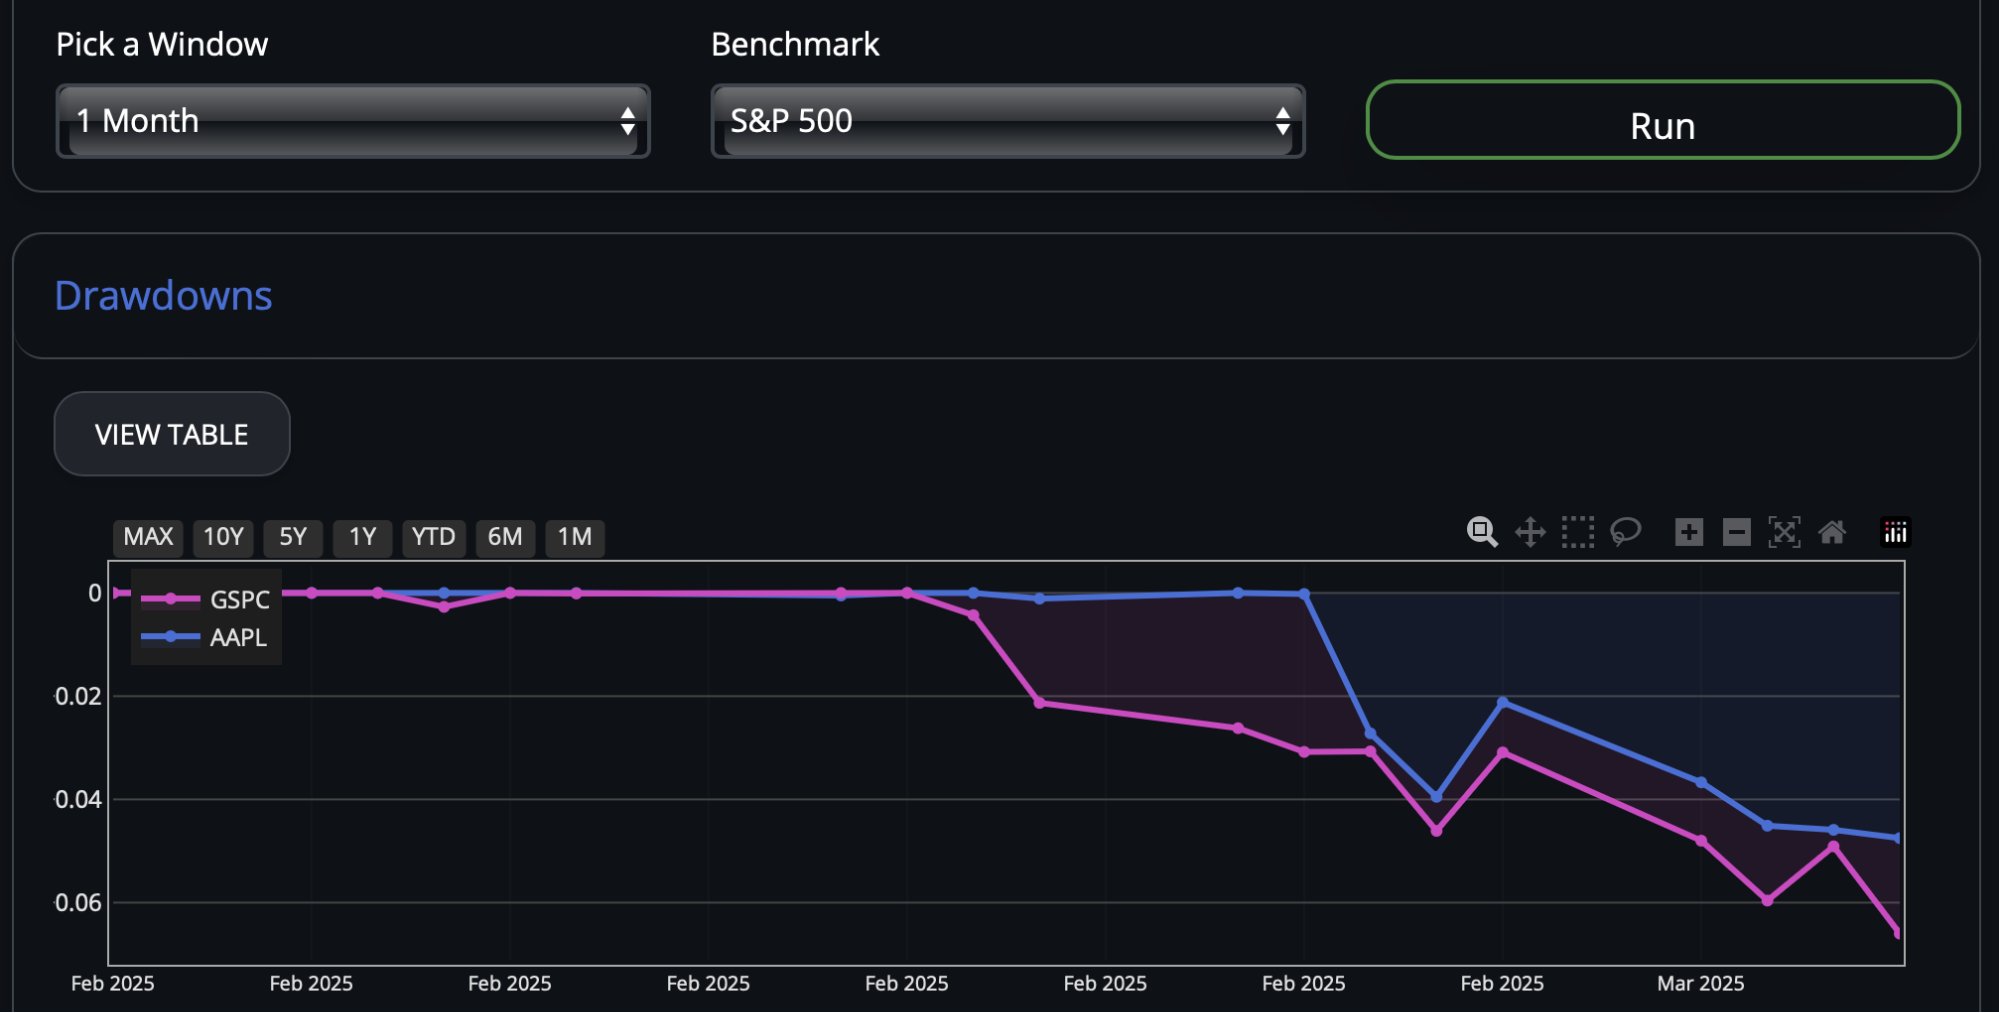
Again, considering the Apple case, the worst 5 drawdowns are found here. In this table, you can find the drawdown has started and ended, the time elapsed to reach the bottom and time passed to recover, and finally, the magnitude (depth) of the drawdown.

Risk-adjusted Ratios
As you may know, there are many risk-adjusted ratios out there, but we tried to pick the most useful ones, which are:
- Sortino Ratio
- Calmar Ratio
- Omega Ratio
- Sharpe Ratio
- Treynor Ratio
- Tail Ratio
You can find all the explanations about these metrics in Stockavisor . If this is not enough, go ahead and ask Finbot for more. Finbot is our chatbot, and I will talk about it soon. Let me give you a visual about what the risk-adjusted ratio analysis looks like just using the Sharpe ratio:

That is it for return analysis, but we have way more than that. Looking forward to seeing you in the other parts of this blog series. In the next blog, we will talk about Financial Statement analysis , which is essential for understanding the financial health of a company.
Join Stockaivisor today and gain access to the latest generative AI tools for financial analysis. Stay ahead of the markets with advanced return analysis, risk assessment, predictive insights, and much more.
Sign up now and take your investing to the next level!
FAQs
Ques: How does Stockaivisor's generative AI differ from traditional financial analysis tools?
Ans: Stockaivisor leverages cutting-edge generative AI to analyze market data, providing deeper insights beyond conventional financial analysis. Unlike traditional tools that rely on static formulas, Stockavisor adapts to market conditions, detects patterns, and generates predictive insights to help investors make data-driven decisions.
Ques: What makes Stockavisor's return analysis unique?
Ans: Stockavisor's return analysis goes beyond simple return calculations. It offers historical performance tracking, drawdown analysis, and risk-adjusted ratios like Sharpe and Sortino. Investors can compare returns against different benchmarks and adjust their strategies accordingly.
Ques: Can I get real-time insights and recommendations from Stockavisor?
Ans: Yes! Stockavisor provides daily insights through AI-powered reporting and Finbot, its intelligent chatbot. You can ask Finbot for explanations on financial metrics, market trends, and investment insights anytime.